ONE Network 3D WMS Game Development
NAVIGATION – GETTING AROUND
– Between Levels
– Between Sites
– Assets
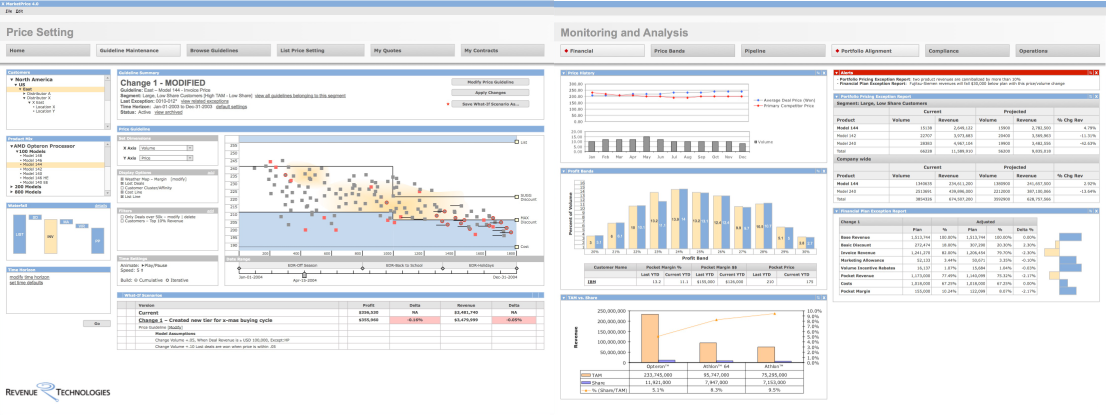
– Within Charts
OBJECTS (3D Models)
– All are Data-Driven to change shape (dimensions), color, or location (time & space)
– Sites / Buildings
– Physical Assets (containers, assembly lines, material, vehicles)
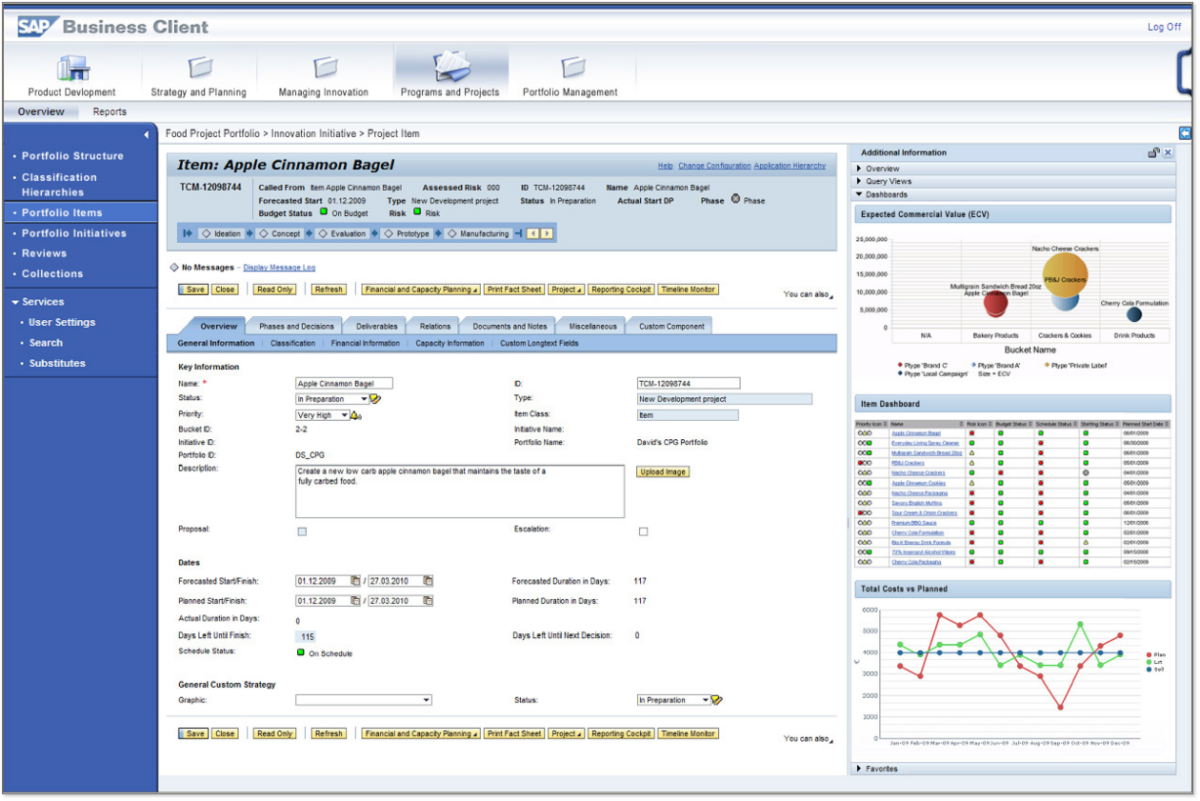
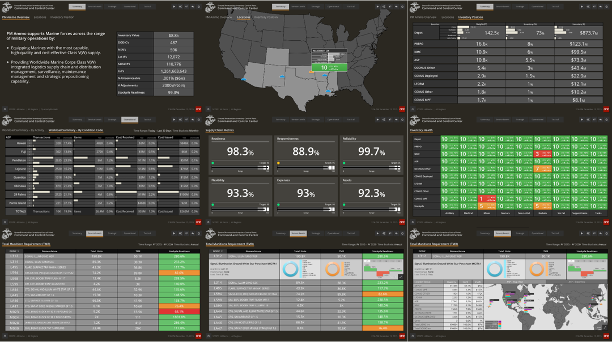
– Charts / Analytics
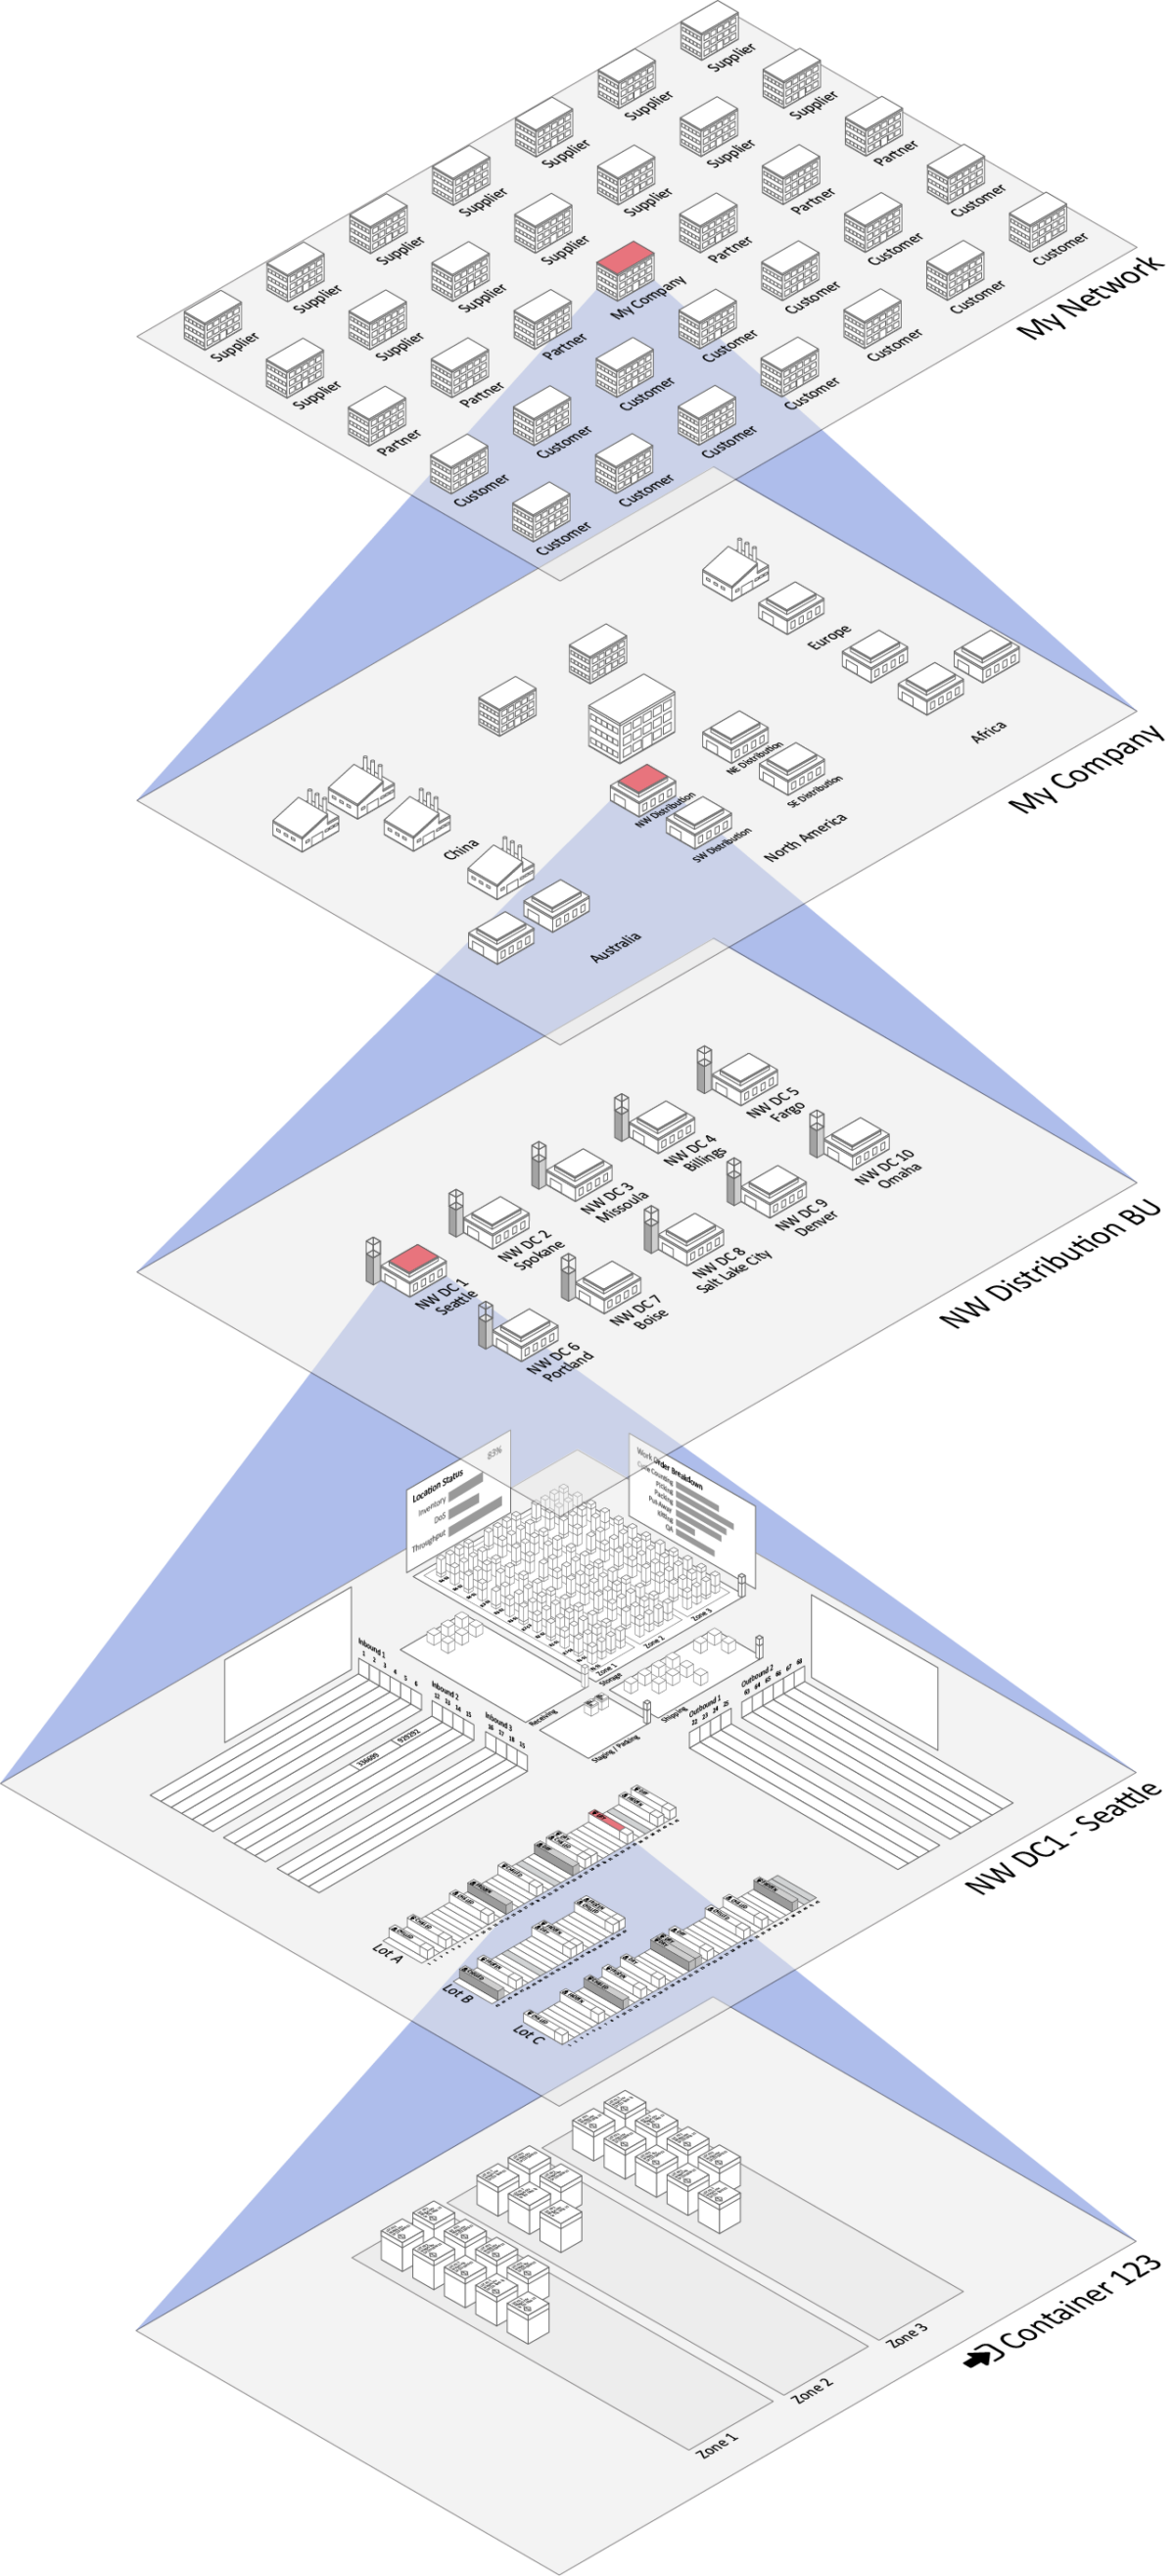
LEVELS
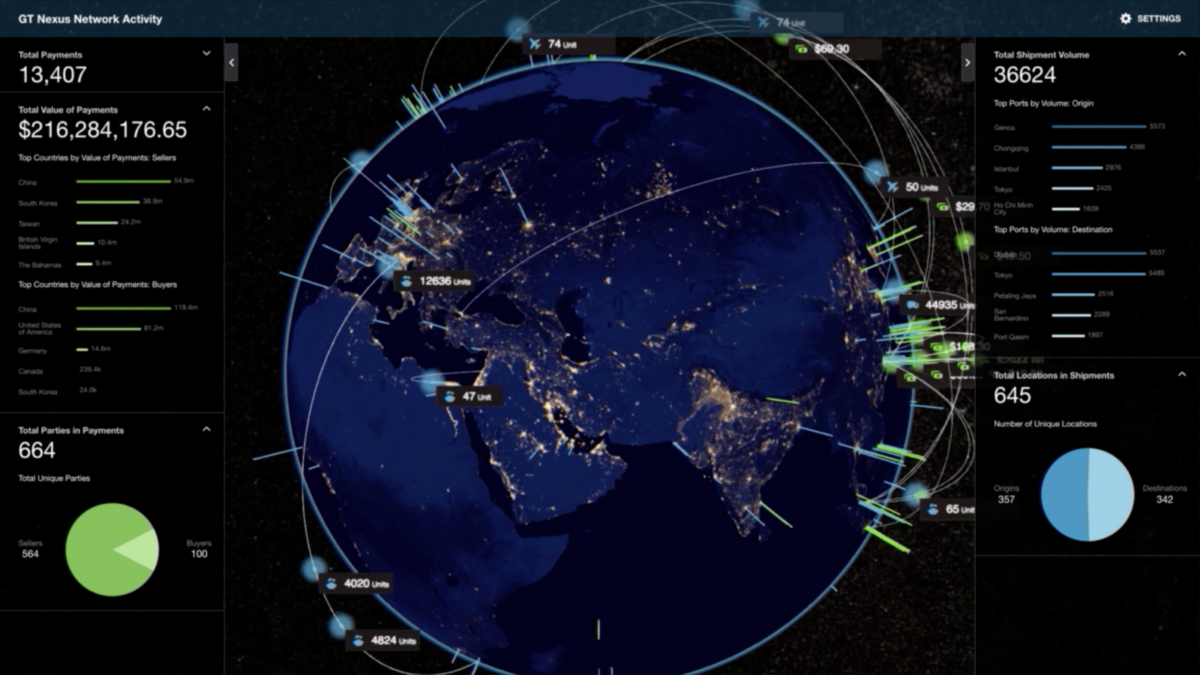
– Network Level View
– Corporate Level View
– LoB Domain Level View (My Locations)
– Site / Inside View
– Warehouse
3D Warehouse Mgmt
Show “Virtual Buffers” in 3D Warehouse
– Receiving
– QA
– Storage
– Staging
Drag and Drop from Storage to Staging (creates a pick-list)
“Level 6 Data” Where is it, what asset, how many, what order
GENERAL NAVIGATION
Navigation from Corp Level
from Inbound Docks / Yard
to
Warehouse (move something from Storage to Staging)
to
Outbound Docks / Yard
– Ability to show resources form multiple locations in a single view
Asset View
GAME MECHANICS
– Purpose / Objective for Player
– Gain Points, Health, Badges, Unlock New Features / Levels
MULTI-PLAYER COLLABORATION
OVERALL SCENE
– Add Timeline to Lanes
– Navigator Menu – Jump to Top View, Side View, Reset View
– Zoom In Out (Stay in Isometric mode)
– Drill Down from a Higher Level to this DC level
APPEARANCE OF OBJECTS
Data to Define the Material (Object)
– Dimensions (Different representations from being a “Trailer” to how it looks in timeline)
– – Container (H=Fixed, W=Fixed, Length=53, 40, 24)
– – Container ON Timeline (H=Fixed, W Fixed, Length=Duration on Schedule)
– Color
– Labels / Graphics (eg JB Hunt as Text or Logo)
Data to Define the Capacity (Lane)
– Dimensions, Color of the Lane
– Segmenting (Schedule States, Occupied, Maintenance, Open)
INTEGRATION
Writing to and from sample Data?
Primary Role: VP Product Management
Secondary Role(s): Designer
Business Driver(s):
Results & Benefits:
Time Range: 2014-2014
Class: Product