Infor Nexus “Big Picture” Visualization

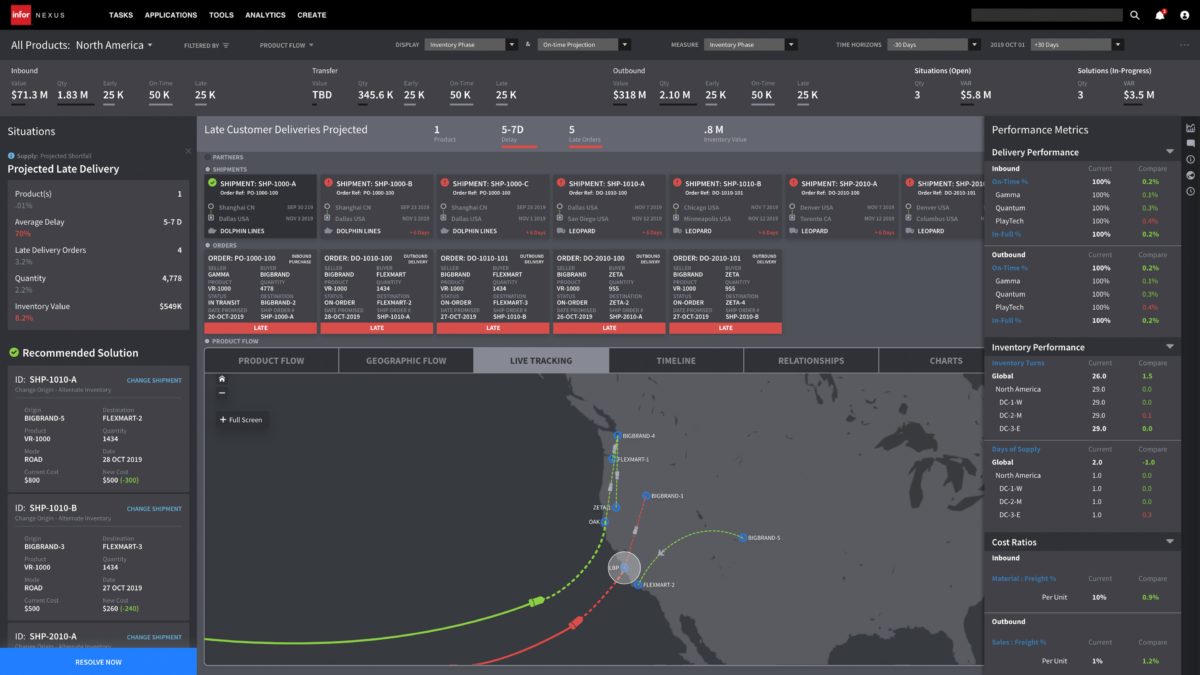
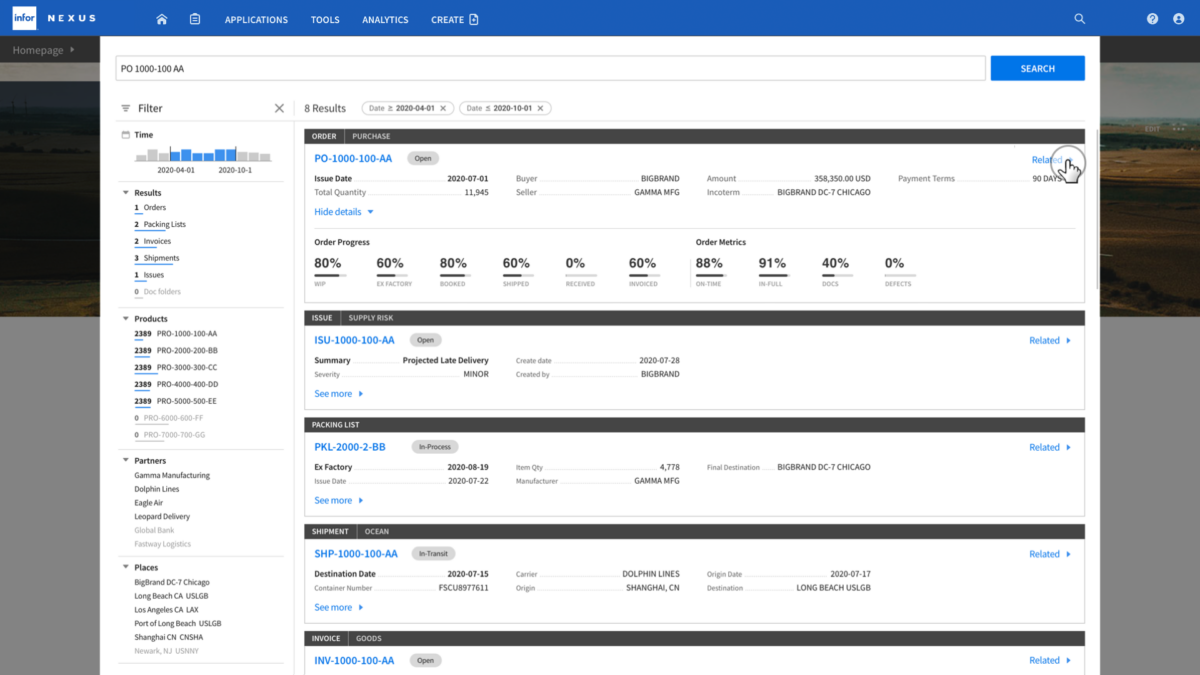
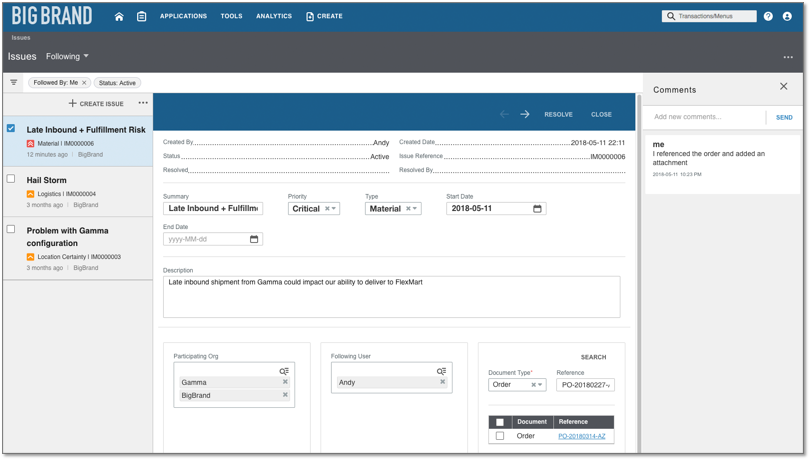
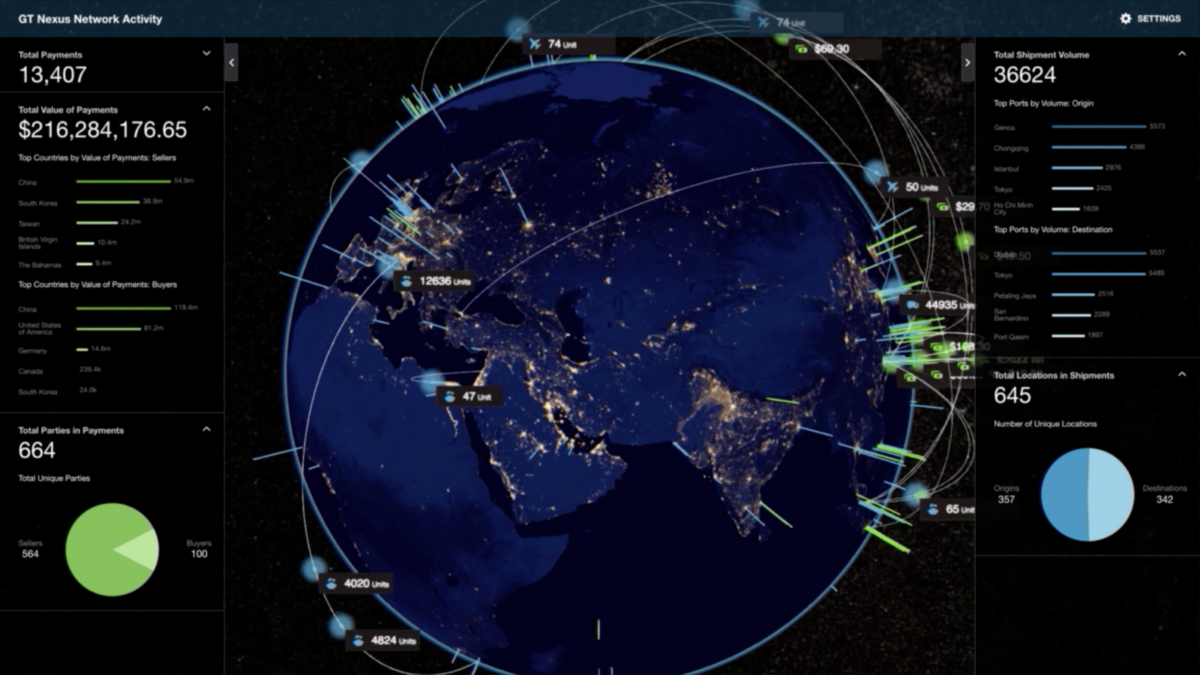
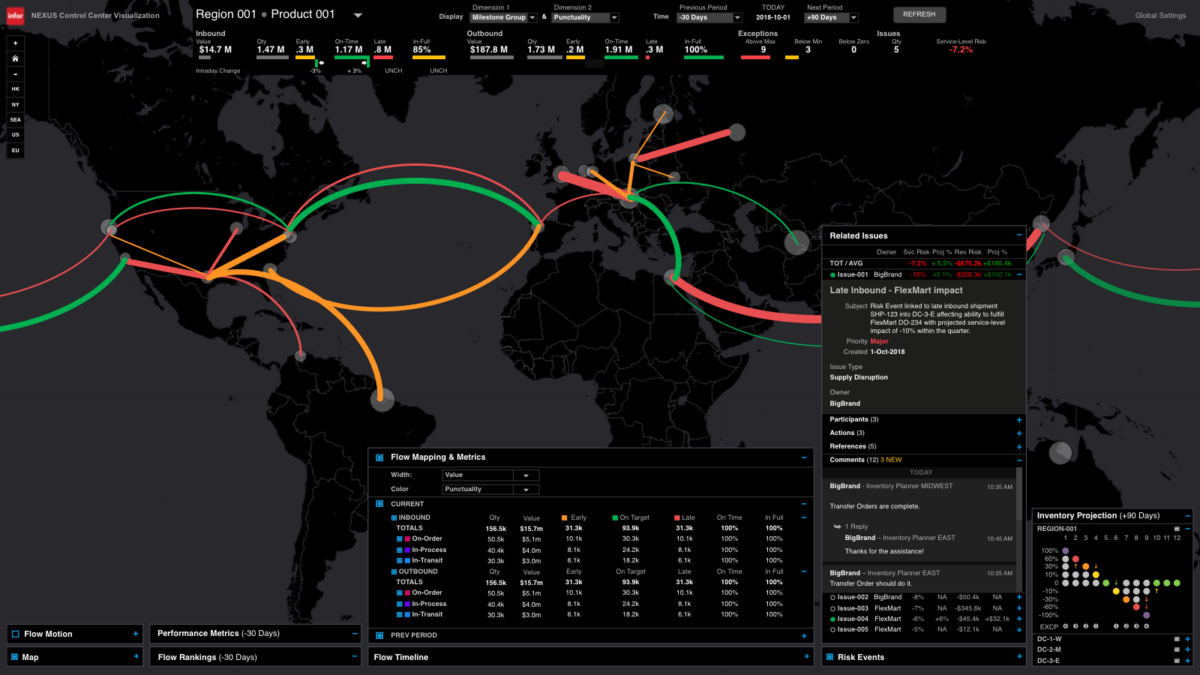
A visualization tool for global supply chain performance, providing fast answers about supply chain performance measures, execution accuracy, and business impact.

Primary Role: VP Product Management
Secondary Role(s): Designer, Visualization Designer, Data Scientist

Business Driver(s): Increased Customer Fatigue, Excess Product Complication, High Demo Effort
Results & Benefits: Improved Customer Enthusiasm, Improved Market Perception, Improved Competitive Position

Time Range: 2017-2017

Class: Product

Infor Nexus Control Center

A supply chain control tower providing real-time visualization of the end-to-end supply chain, with predictive insights, intelligent decision-support, and collaborative execution – to improve supply chain velocity, agility, and responsiveness.

Primary Role: VP Product Management
Secondary Role(s): Designer, Visualization Designer, Data Scientist

Business Driver(s): Excess Product Complication, Low Product Perception, Low Demo Effectiveness
Results & Benefits: Improved Customer Enthusiasm, Improved Competitive Position, Enhanced Portfolio Alignment, Expanded Pipeline Growth, Improved Team Efficiency

Time Range: 2017-2020

Class: Product

Infor NEXUS Search

Search for any type of business object and its related objects. Search by key references and other methods such as partners, places, and products. Visualize Physical & Financial Flow, Geographic / Map, and Time-Oriented views. Ex: View an Order + all related transactions past present, and future.

Primary Role: VP Product Management
Secondary Role(s): Product Strategy, Designer

Business Driver(s): Existing Search Unusable, Fragmented Search Methods
Results & Benefits: Improved Customer Enthusiasm, Improved Market Perception, Enhanced Portfolio Alignment, Reduced Tech Debt

Time Range: 2020-2020

Class: Product

Infor Nexus Issue Management

A solution for collaborative issue management, enabling organizations to identify, analyze, evaluate, act on, and monitor issues collaboratively.

Primary Role: VP Product Management
Secondary Role(s): Product Strategy

Business Driver(s): Capture Market Opportunity, Increased Competitive Pressure
Results & Benefits: Improved Customer Enthusiasm, Enhanced Customer Retention, Improved Market Perception

Time Range: 2017-2020

Class: Product

i2 Tradematrix B2B Marketplaces

i2 TradeMatrix Defined B2B Marketplaces in the Dot-Com / eBusiness era
– Real-time visibility, measurement and analytics
– Multi-party collaboration for continuous improvement
– Shared, multi-party performance metrics and KPIs
Business Impact
– Defined the B2B Market
– Significant Growth Driver
– Customer Enthusiasm
– Competitive Boost
– Portfolio Rationalization

Primary Role: Vice President & General Manager
Secondary Role(s):

Business Driver(s): Capture Market Opportunity
Results & Benefits: Enhanced Portfolio Alignment, Improved Market Perception, Improved Customer Enthusiasm

Time Range: 1999-2002

Class: Product

SAP PLM – Contextual Analytics

Robb was the product “owner” for SAP’s first “embedded analytics” solution that presented contextual analytics related to the business object (eg Project, Order, Customer, Item, etc). This capability shipped with SAP Business Suite 5.
With SAP’s acquisition of Business Objects, additional tools became available. Robb led the specification and development of Dashboards for analyzing Product and Service performance.

Primary Role: Sr. Director – Solution Management
Secondary Role(s):

Business Driver(s): Capture Market Opportunity
Results & Benefits: Improved Customer Enthusiasm

Time Range: 2008-2009

Class: Product